文章目录
目录
- 后端:app.py
- 前端模板:templates/index.html
- 使用方式
- 功能特点
- 相关文章
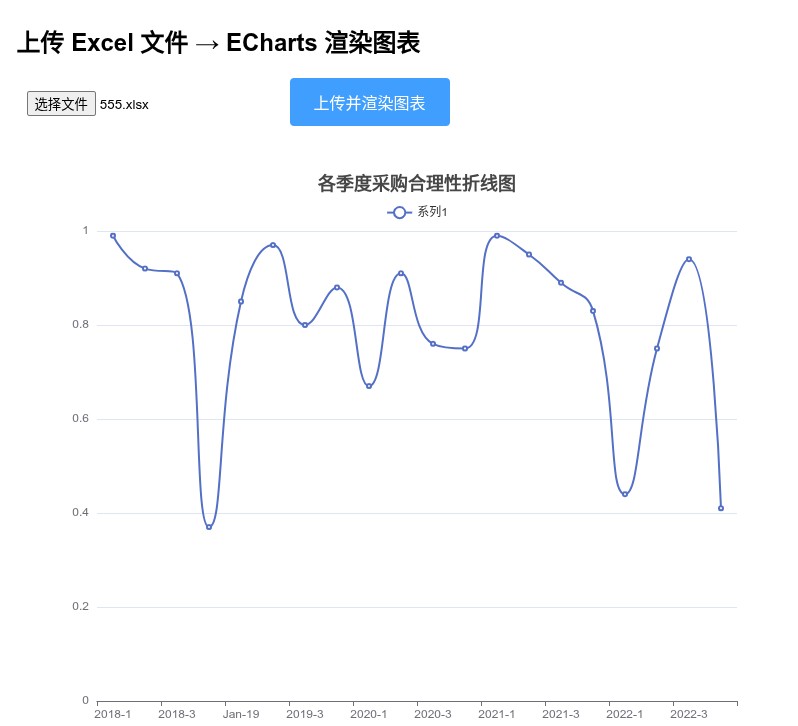
以下是完整的 Flask + Vue 3 前端模板 方案,实现 上传 Excel 文件(不再用链接),后端解析 chart1.xml,返回结构化数据,前端用 ECharts 渲染图表。
效果如下
项目结构
project/
├── app.py
├── templates/
│ └── index.html
import xml.etree.ElementTree as ET
import io
from zipfile import ZipFile, BadZipFile
from flask import Flask, render_template, request, jsonify
from flask_cors import CORS  # 可选,如果有跨域需求

app = Flask(__name__)
CORS(app)  # 允许跨域(同域其实不需要,但留着保险)

def parse_chart_from_bytes(file_data):
    res = {}
    result = {}
    try:
        archive = ZipFile(io.BytesIO(file_data))
        chart_data = archive.read('xl/charts/chart1.xml')

        res['code'] = 200
        res['msg'] = "获取图表信息成功"

        tree = ET.parse(io.BytesIO(chart_data))
        root = tree.getroot()

        ns = {
            'c': 'http://schemas.openxmlformats.org/drawingml/2006/chart',
            'a': 'http://schemas.openxmlformats.org/drawingml/2006/main'
        }

        # 图表类型
        type_mapping = [
            ('pieChart', '饼图', 'pie'),
            ('lineChart', '折线图', 'line'),
            ('barChart', '柱形图', 'bar'),
            ('areaChart', '面积图', 'line'),
            ('scatterChart', '散点图', 'scatter'),
            ('radarChart', '雷达图', 'radar'),
        ]
        chart_type_cn = '其它'
        echarts_type = 'line'
        is_area = False
        for tag, cn, en in type_mapping:
            if root.find(f'.//c:{tag}', ns) is not None:
                chart_type_cn = cn
                echarts_type = en
                if cn == '面积图':
                    is_area = True
                break

        result['chart_type_cn'] = chart_type_cn
        result['echarts_type'] = echarts_type
        result['is_area'] = is_area

        # 标题
        title_text = ""
        title_elem = root.find('.//c:title/c:tx/c:rich', ns)
        if title_elem is not None:
            for t in title_elem.iterfind('.//a:t', ns):
                if t.text:
                    title_text += t.text
        result['title'] = title_text.strip() or "无标题"

        # 系列数据
        series_list = []
        ser_elements = root.findall('.//c:ser', ns)

        for idx, ser in enumerate(ser_elements):
            # 系列名称
            name_elem = ser.find('c:tx/c:v', ns)
            name = name_elem.text if name_elem is not None else f"系列{idx + 1}"

            # 类别(X轴)
            cat_vs = ser.findall('c:cat//c:pt/c:v', ns)
            categories = [v.text for v in cat_vs if v.text is not None]

            # 数值(Y轴)
            val_vs = ser.findall('c:val//c:pt/c:v', ns)
            values = []
            for v in val_vs:
                if v.text:
                    try:
                        values.append(float(v.text))
                    except ValueError:
                        values.append(v.text)

            series_list.append({
                "name": name,
                "categories": categories,
                "data": values
            })

        # 共享类别轴(如果每个系列都没有独立类别)
        if series_list and all(len(s['categories']) == 0 for s in series_list):
            shared_vs = root.findall('.//c:cat//c:pt/c:v', ns)
            shared_cat = [v.text for v in shared_vs if v.text is not None]
            if shared_cat:
                for s in series_list:
                    s['categories'] = shared_cat

        # 饼图特殊处理
        if chart_type_cn == "饼图" and series_list:
            for s in series_list:
                pie_data = []
                cats = s['categories'] or [f"项{i+1}" for i in range(len(s['data']))]
                for i, val in enumerate(s['data']):
                    name = cats[i] if i < len(cats) else f"项{i+1}"
                    value = val if isinstance(val, (int, float)) else 0
                    pie_data.append({"name": name, "value": value})
                s['data'] = pie_data

        # 最终类别轴(非饼图)
        if chart_type_cn != "饼图" and series_list and series_list[0]['categories']:
            result['categories'] = series_list[0]['categories']
        else:
            result['categories'] = []

        # 系列(只保留 name 和 data)
        result['series'] = [{"name": s["name"], "data": s["data"]} for s in series_list]

        res['data'] = result

    except BadZipFile:
        res['code'] = 404
        res['msg'] = "无效的Excel文件"
    except KeyError:
        res['code'] = 404
        res['msg'] = "未找到图表信息(无chart1.xml)"
    except Exception as e:
        res['code'] = 500
        res['msg'] = f"解析失败: {str(e)}"

    return res


@app.route('/')
def index():
    return render_template('index.html')


@app.route('/api/upload_chart', methods=['POST'])
def upload_chart():
    if 'file' not in request.files:
        return jsonify({"code": 400, "msg": "没有上传文件"})

    file = request.files['file']
    if file.filename == '' or not file.filename.lower().endswith('.xlsx'):
        return jsonify({"code": 400, "msg": "请上传 .xlsx 文件"})

    file_data = file.read()
    return jsonify(parse_chart_from_bytes(file_data))


if __name__ == '__main__':
    app.run(host='127.0.0.1', port=5000, debug=True)
<!DOCTYPE html>
<html lang="zh-CN">
<head>
  <meta charset="UTF-8">
  <title>上传 Excel → ECharts 渲染</title>
  <script src="https://cdn.jsdelivr.net/npm/vue@3.4.21/dist/vue.global.prod.js"></script>
  <script src="https://cdn.jsdelivr.net/npm/echarts@5.5.0/dist/echarts.min.js"></script>
  <style>
    body { font-family: Arial, sans-serif; padding: 20px; background: #f5f5f5; }
    .container { max-width: 800px; margin: auto; background: white; padding: 30px; border-radius: 8px; box-shadow: 0 2px 10px rgba(0,0,0,0.1); }
    input[type="file"] { padding: 10px; margin-bottom: 15px; }
    button { padding: 12px 24px; font-size: 16px; background: #409eff; color: white; border: none; border-radius: 4px; cursor: pointer; }
    button:hover { background: #66b1ff; }
    button:disabled { background: #a0cfff; cursor: not-allowed; }
    #chart { width: 100%; height: 600px; margin-top: 30px; }
    .msg { margin: 15px 0; font-weight: bold; color: #e6a23c; }
  </style>
</head>
<body>
<div id="app" class="container">
  <h2>上传 Excel 文件 → ECharts 渲染图表</h2>
  <input type="file" accept=".xlsx" @change="onFileChange" />
  <button @click="uploadAndRender" :disabled="!selectedFile">上传并渲染图表</button>
  <div class="msg">{{ message }}</div>
  <div ref="chartRef" id="chart"></div>
</div>

<script>
const { createApp, ref, onMounted, nextTick } = Vue;

createApp({
  setup() {
    const selectedFile = ref(null);
    const message = ref('请选择一个包含图表的 .xlsx 文件');
    const chartRef = ref(null);
    let myChart = null;

    onMounted(() => {
      myChart = echarts.init(chartRef.value);
    });

    const onFileChange = (e) => {
      const file = e.target.files[0];
      if (file && file.name.endsWith('.xlsx')) {
        selectedFile.value = file;
        message.value = `已选择文件:${file.name}`;
      } else {
        selectedFile.value = null;
        message.value = '请上传 .xlsx 文件';
      }
    };

    const uploadAndRender = async () => {
      if (!selectedFile.value) return;

      message.value = '正在上传并解析...';

      const formData = new FormData();
      formData.append('file', selectedFile.value);

      try {
        const response = await fetch('/api/upload_chart', {
          method: 'POST',
          body: formData
        });

        const json = await response.json();

        if (json.code !== 200) {
          message.value = `错误:${json.msg}`;
          return;
        }

        const data = json.data;

        const option = {
          title: { text: data.title, left: 'center', textStyle: { fontSize: 18 } },
          tooltip: { trigger: data.echarts_type === 'pie' ? 'item' : 'axis' },
          legend: { data: data.series.map(s => s.name), top: 30 }
        };

        if (data.echarts_type === 'pie') {
          option.series = data.series.map(s => ({
            type: 'pie',
            name: s.name,
            radius: '55%',
            center: ['50%', '60%'],
            data: s.data,
            emphasis: { itemStyle: { shadowBlur: 10, shadowOffsetX: 0, shadowColor: 'rgba(0, 0, 0, 0.5)' } }
          }));
        } else if (data.echarts_type === 'radar') {
          const maxVal = Math.max(...data.series.flatMap(s => s.data.filter(v => typeof v === 'number')), 100);
          option.radar = {
            indicator: data.categories.map(name => ({ name, max: maxVal * 1.2 }))
          };
          option.series = [{
            type: 'radar',
            data: data.series.map(s => ({ name: s.name, value: s.data }))
          }];
        } else {
          option.xAxis = { type: 'category', data: data.categories };
          option.yAxis = { type: 'value' };
          option.series = data.series.map(s => ({
            type: data.echarts_type,
            name: s.name,
            data: s.data,
            areaStyle: data.is_area ? { opacity: 0.3 } : undefined,
            smooth: data.echarts_type === 'line' ? true : false
          }));
        }

        await nextTick();
        myChart.setOption(option, true);
        message.value = `渲染成功!图表类型:${data.chart_type_cn}(${data.series.length} 个系列)`;

      } catch (err) {
        message.value = '上传或解析失败:' + err.message;
        console.error(err);
      }
    };

    return { selectedFile, message, chartRef, onFileChange, uploadAndRender };
  }
}).mount('#app');
</script>
</body>
</html>
1.安装依赖:
pip install flask flask-cors
2.把上面的文件按结构放好。
3.运行:
python app.py
4.浏览器打开 http://127.0.0.1:5000
5.选择一个包含图表(chart1)的 .xlsx 文件 → 点击“上传并渲染图表”
- 支持上传本地 Excel 文件解析(安全,只读内存)。
- 支持单/多系列图表。
- 饼图、折线、柱形、面积、散点、雷达图基本还原。
- 前端美化了些样式和交互。
Python使用openpyxl从URL读取Excel并获取单元格样式
Python解析Excel图表Chart的信息实战指南
到此这篇关于Python使用Flask后端实现解析Excel图表(附源码)的文章就介绍到这了,更多相关Python Flask解析Excel图表内容请搜索风君子博客以前的文章或继续浏览下面的相关文章希望大家以后多多支持风君子博客!
您可能感兴趣的文章:
- Python解析Excel图表Chart的信息实战指南
- Python3实现解析XML文件并存入Excel表中
- Python如何实现xml解析并输出到Excel上
- Python自动化办公Excel模块openpyxl原理及用法解析
- Python读取Excel数据并生成图表过程解析
- Python实现读取并写入Excel文件过程解析
- Python使用Pandas读写Excel实例解析
- python自动化测试之如何解析excel文件
- 使用python3+xlrd解析Excel的实例