文章目录
目录
- 前言
- 使用Matplotlib库完成基本的图表交互
- 实现图表的高阶交互
- 全部代码
- 总结
最近在使用pyqt结合matplotlib开发一款内部使用的数据分析软件,发现matplotlib库在处理大数据,出图性能方面还是很不错的,但是就是图表的交互性上差了一点,比如说图像的放大和缩小,移动的光标线,显示注释等等,很多还是需要自己造轮子,本人通过五一假期的一番研究,从中也颇有收获,现在把下面的这些研究成果分享给大家。
初始化基本的曲线配置
import sys

import numpy as np
from PySide6.QtWidgets import QApplication, QMainWindow, QVBoxLayout, QWidget
from matplotlib.backends.backend_qt5agg import FigureCanvasQTAgg as FigureCanvas
from matplotlib.figure import Figure

class MatplotlibWidget(FigureCanvas):
    def __init__(self, parent=None, width=5, height=4, dpi=100):
        fig = Figure(figsize=(width, height), dpi=dpi)
        self.axes = fig.add_subplot(111)

        self.compute_initial_figure()

        FigureCanvas.__init__(self, fig)
        self.setParent(parent)
        self.lef_mouse_pressed = False  # 鼠标左键是否按下
       	self.connect_event()

    def connect_event(self):
        return	#添加鼠标事件,后续在这里添加

    def compute_initial_figure(self):
        x = np.linspace(0, 10, 100)
        y1 = np.sin(x)
        y2 = np.cos(x)
        y3 = np.sin(x) * 2
        self.line1, = self.axes.plot(x, y1, 'b-', label='sin(x)')
        self.line2, = self.axes.plot(x, y2, 'r-', label='cos(x)')
        self.line3, = self.axes.plot(x, y3, 'g-', label='2*sin(x)')
        self.axes.legend()  # 显示右上角标签


class MainWindow(QMainWindow):
    def __init__(self):
        super().__init__()

        self.widget = QWidget()
        self.setMinimumHeight(600)
        self.setMinimumWidth(800)
        self.showMaximized() # 设置全屏
        self.setCentralWidget(self.widget)

        layout = QVBoxLayout(self.widget)

        self.mpl_widget = MatplotlibWidget(self.widget, width=5, height=4, dpi=100)
        layout.addWidget(self.mpl_widget)

        self.show()


if __name__ == "__main__":
    app = QApplication(sys.argv)
    mainWin = MainWindow()
    sys.exit(app.exec_())
现在的图像应该是这个效果
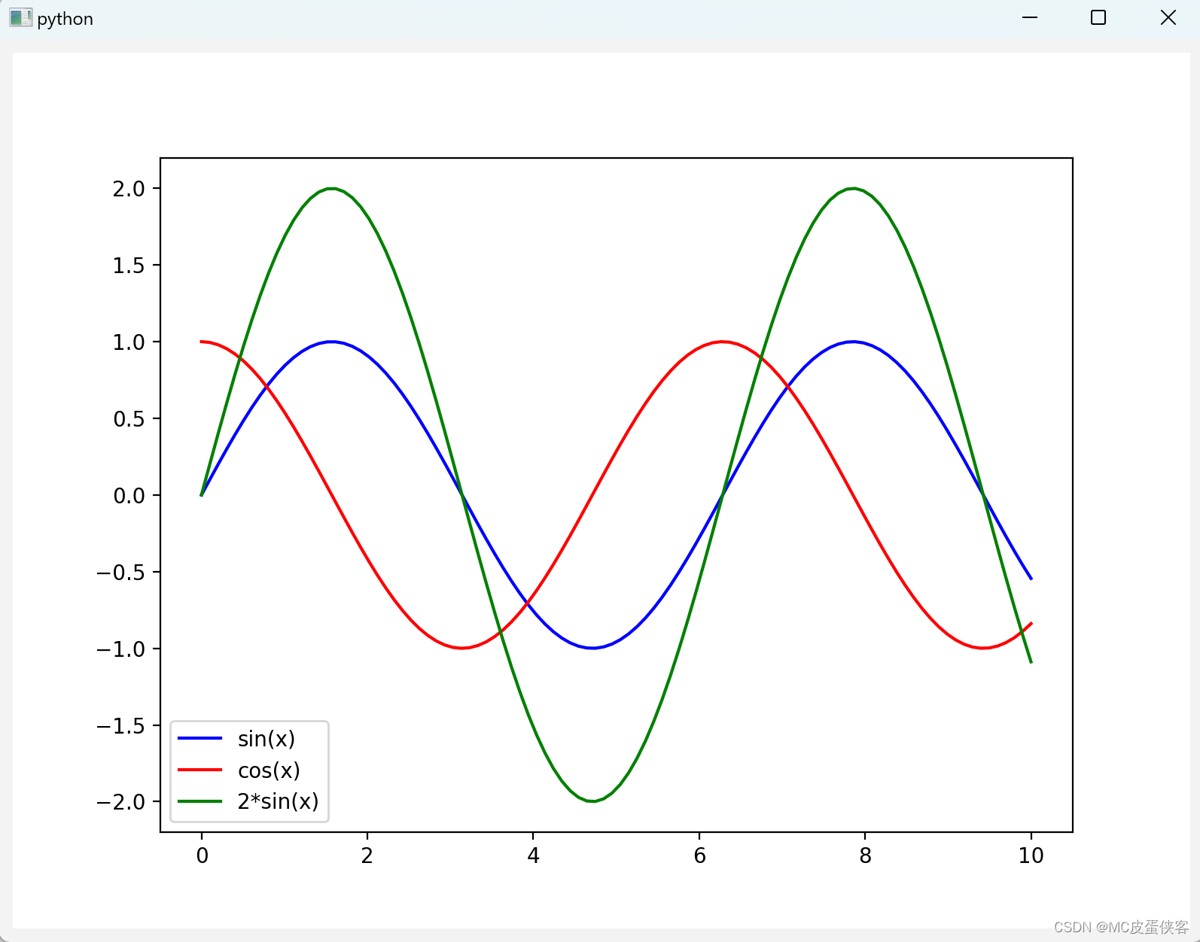
添加鼠标滚动放大和缩小效果,比例可以自己设置,我这里设置的是最大值和最小值差值的10分之1
    def on_mouse_wheel(self, event):
        if self.axes is not None:
            x_min, x_max = self.axes.get_xlim()
            x_delta = (x_max - x_min) / 10		# 控制缩放X轴的比例
            y_min, y_max = self.axes.get_ylim()
            y_delta = (y_max - y_min) / 10		# 控制缩放X轴的比例
            if event.button == "up":
                self.axes.set(xlim=(x_min + x_delta, x_max - x_delta))
                self.axes.set(ylim=(y_min + y_delta, y_max - y_delta))
            elif event.button == "down":
                self.axes.set(xlim=(x_min - x_delta, x_max + x_delta))
                self.axes.set(ylim=(y_min - y_delta, y_max + y_delta))

            self.draw_idle()
添加鼠标滚动事件到connect_event()函数里面
    def connect_event(self):
        self.mpl_connect("scroll_event", self.on_mouse_wheel)	#鼠标滚动事件
实现按住鼠标向上下左右拖动的效果,拖动的距离同理可以自己控制
    def on_button_press(self, event):
        if event.inaxes is not None:  # 判断是否在坐标轴内
            if event.button == 1:
                self.lef_mouse_pressed = True
                self.pre_x = event.xdata
                self.pre_y = event.ydata

    def on_button_release(self, event):
        self.lef_mouse_pressed = False

    def on_mouse_move(self, event):
        if event.inaxes is not None and event.button == 1:
            if self.lef_mouse_pressed:	#鼠标左键按下时才计算
                x_delta = event.xdata - self.pre_x
                y_delta = event.ydata - self.pre_y
                # 获取当前原点和最大点的4个位置
                x_min, x_max = self.axes.get_xlim()
                y_min, y_max = self.axes.get_ylim()

                # 控制一次移动鼠标拖动的距离
                x_min = x_min - x_delta
                x_max = x_max - x_delta
                y_min = y_min - y_delta
                y_max = y_max - y_delta

                self.axes.set_xlim(x_min, x_max)
                self.axes.set_ylim(y_min, y_max)
                self.draw_idle()
添加鼠标按住和松开事件到connect_event()函数里面
    def connect_event(self):
        self.mpl_connect("scroll_event", self.on_mouse_wheel)
        self.mpl_connect("button_press_event", self.on_button_press)
        self.mpl_connect("button_release_event", self.on_button_release)
        self.mpl_connect("motion_notify_event", self.on_mouse_move)
现在图像可以实现如下效果
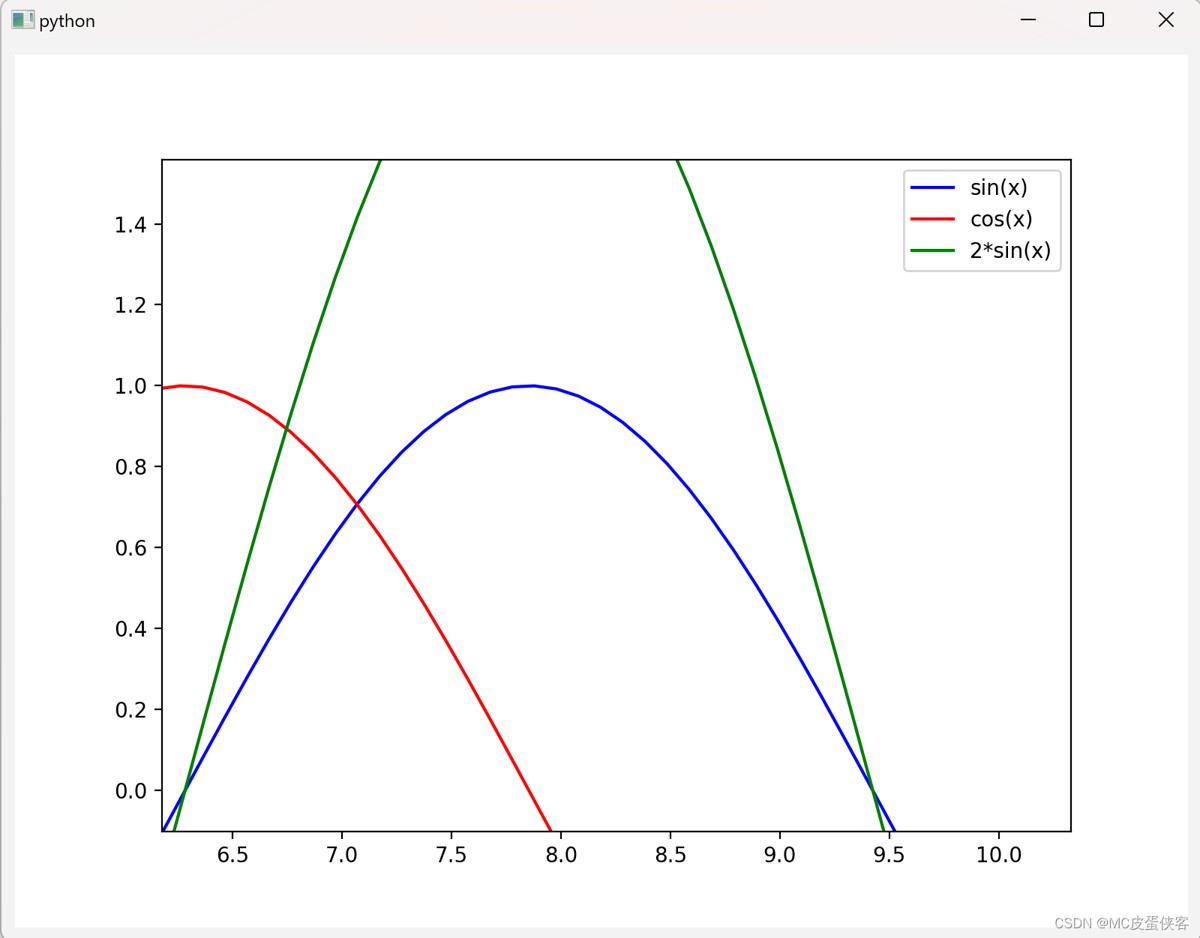
可以看到鼠标按住后把图像拖动了,同时鼠标滚动也放大了图像
我们最终想达到的目标是能够实现类似echarts库的功能,能够随着鼠标移动显示一条竖的光标线,光标线旁边能够显示详细信息,效果跟下图所示差不多
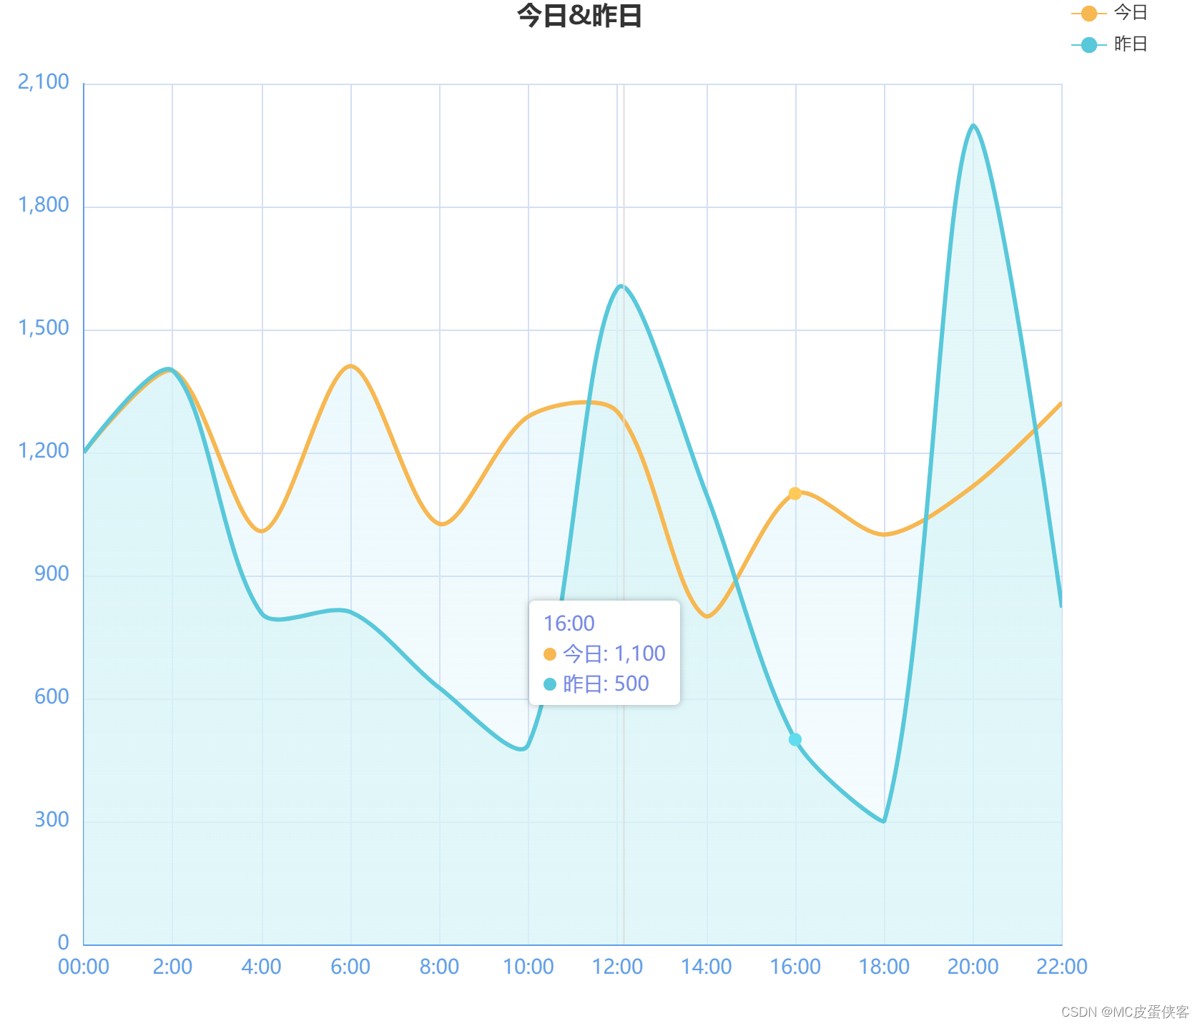
接下来我们使用matplotlib实现如图效果
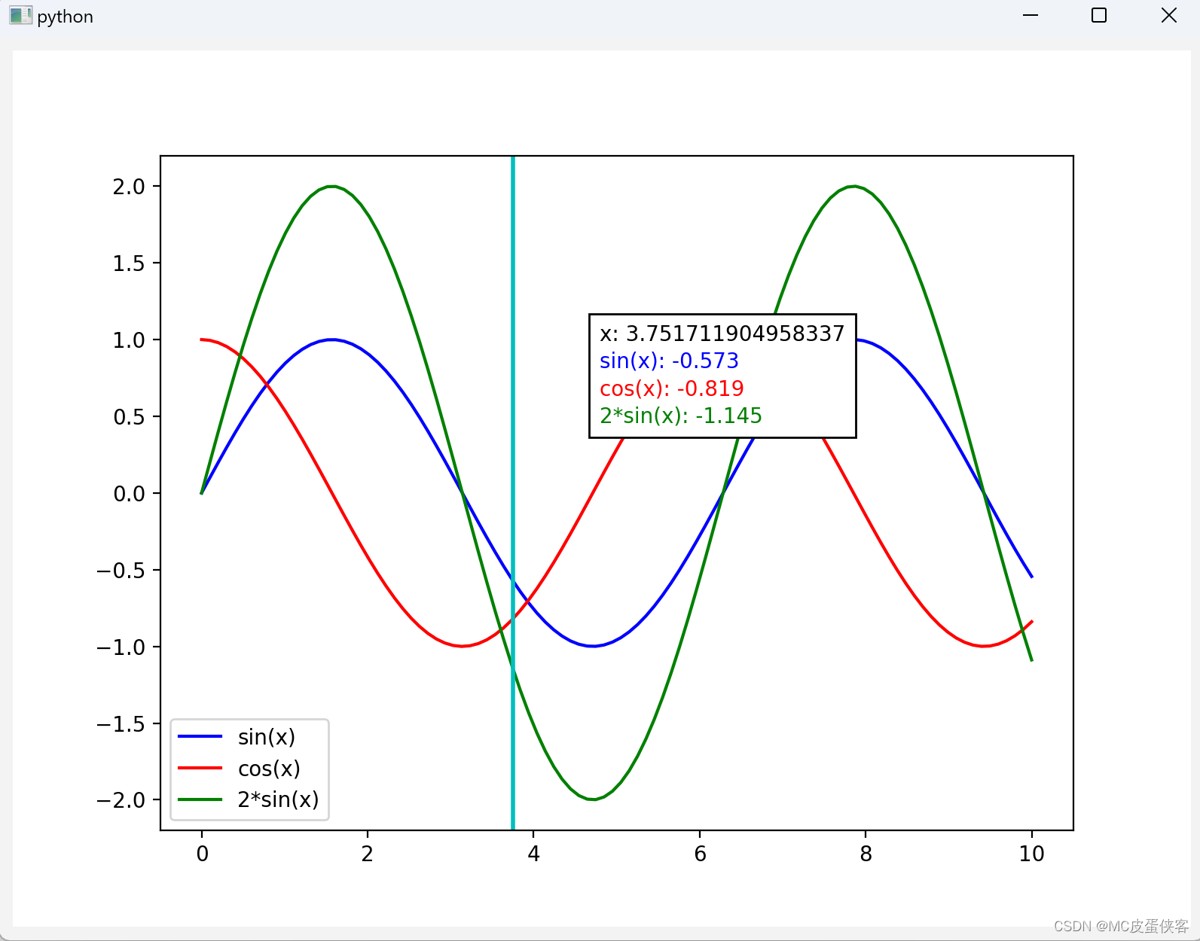
给图表添加一个竖光标线,在图表中可以随着鼠标移动而移动,在光标线旁边显示相应的曲线信息
    def init_annotation(self):
        # 初始化光标线和注释
        self.vertline, = self.ax.plot([], [], 'c-', lw=2)
        # 预置一个空文本显示横坐标值
        hPackerList = [HPacker(children=[TextArea("", textprops=dict(size=10))])]
        for line in self.axes.get_lines():
            if line == self.vertline:  # 跳过光标线
                continue
            line_color = line.get_color()   # 获取每条曲线的颜色
            text_area = TextArea(line.get_label(), textprops=dict(size=10, color=line_color))   #根据曲线颜色设置文字颜色
            hPacker = HPacker(children=[text_area])
            hPackerList.append(hPacker)
        self.text_box = VPacker(children=hPackerList, pad=1, sep=3) # 竖值布局,设置padding和文字之间上下的间距
        self.annotation_bbox = AnnotationBbox(self.text_box, (0, 0),
                                              xybox=(100, 0),
                                              xycoords='data',
                                              boxcoords="offset points")
        if self.axes is not None:
            self.axes.add_artist(self.annotation_bbox)
将init_annotation函数放到初始化init函数里面
添加hover函数,使竖光标线和注释随着鼠标的移动能够动态地做出改变,这里使用了annocation_bbox,这个工具网上资料很少,我也是临时翻英文文档看的,gpt生成的错误代码用不了,如果需要详细了解可以翻阅matlibplot的官方文档,hPacker和vPacker类似于qt的hBoxlayout和vBoxLayout,还是比较好理解的,还有textarea是可以设置颜色的
    def hover(self, event):
        if event.inaxes == self.axes:
            x = event.xdata
            if x is not None:
                text = f"x: {x}" #显示横坐标值
                hPacker_list = self.text_box.get_children()
                time_hPacker = hPacker_list[0]
                time_text_area: TextArea = time_hPacker.get_children()[0]
                time_text_area.set_text(text)   # 更新横坐标值
                for index,line in enumerate(self.axes.get_lines()):
                    if line == self.vertline:  # 跳过光标线
                        continue
                    x_data = line.get_xdata()
                    y_data = line.get_ydata()
                    y = np.interp(x, x_data, y_data)
                    # 更新光标线的位置
                    self.vertline.set_xdata([x, x])
                    self.vertline.set_ydata([self.axes.get_ylim()[0], self.axes.get_ylim()[1]])
                    # 显示每条曲线的详细信息
                    line_text = f"{line.get_label()}: {y:.3f}"
                    hPacker = hPacker_list[index+1] # 因为横坐标值放在了第一个hPacker中,所以从第二个开始
                    text_area: TextArea = hPacker.get_children()[0]
                    text_area.set_text(line_text)

                # 更新AnnotationBbox的位置
                self.annotation_bbox.xy = (x, event.ydata)
                self.annotation_bbox.set_visible(True)
                self.draw_idle()
            else:
                # 隐藏AnnotationBbox和光标线
                self.annotation_bbox.set_visible(False)
                self.vertline.set_xdata([])
                self.vertline.set_ydata([])
                self.draw_idle()
将hover函数添加到connect_event()函数中
    def connect_event(self):
        self.mpl_connect("scroll_event", self.on_mouse_wheel)
        self.mpl_connect("button_press_event", self.on_button_press)
        self.mpl_connect("button_release_event", self.on_button_release)
        self.mpl_connect("motion_notify_event", self.on_mouse_move)
        self.mpl_connect("motion_notify_event", self.hover)
最终实现效果
import sys

import numpy as np
from PySide6.QtWidgets import QApplication, QMainWindow, QVBoxLayout, QWidget
from matplotlib.backends.backend_qt5agg import FigureCanvasQTAgg as FigureCanvas
from matplotlib.figure import Figure
from matplotlib.offsetbox import HPacker, TextArea, VPacker, AnnotationBbox


class MatplotlibWidget(FigureCanvas):
    def __init__(self, parent=None, width=5, height=4, dpi=100):
        fig = Figure(figsize=(width, height), dpi=dpi)
        self.axes = fig.add_subplot(111)
        self.lef_mouse_pressed = False  # 鼠标左键是否按下

        self.compute_initial_figure()

        FigureCanvas.__init__(self, fig)
        self.setParent(parent)

        self.connect_event()

        self.init_annotation()

    def connect_event(self):
        self.mpl_connect("scroll_event", self.on_mouse_wheel)
        self.mpl_connect("button_press_event", self.on_button_press)
        self.mpl_connect("button_release_event", self.on_button_release)
        self.mpl_connect("motion_notify_event", self.on_mouse_move)
        self.mpl_connect("motion_notify_event", self.hover)

    def compute_initial_figure(self):
        x = np.linspace(0, 10, 100)
        y1 = np.sin(x)
        y2 = np.cos(x)
        y3 = np.sin(x) * 2
        self.line1, = self.axes.plot(x, y1, 'b-', label='sin(x)')
        self.line2, = self.axes.plot(x, y2, 'r-', label='cos(x)')
        self.line3, = self.axes.plot(x, y3, 'g-', label='2*sin(x)')
        self.axes.legend()  # 显示右上角标签

    def init_annotation(self):
        # 初始化光标线和注释
        self.vertline, = self.axes.plot([], [], 'c-', lw=2)
        hPackerList = [HPacker(children=[TextArea("", textprops=dict(size=10))])]  # 预置一个空文本显示横坐标值
        for line in self.axes.get_lines():
            if line == self.vertline:  # 跳过光标线
                continue
            line_color = line.get_color()   # 获取每条曲线的颜色
            text_area = TextArea(line.get_label(), textprops=dict(size=10, color=line_color))   #根据曲线颜色设置文字颜色
            hPacker = HPacker(children=[text_area])
            hPackerList.append(hPacker)
        self.text_box = VPacker(children=hPackerList, pad=1, sep=3) # 竖值布局,设置padding和文字之间上下的间距
        self.annotation_bbox = AnnotationBbox(self.text_box, (0, 0),
                                              xybox=(100, 0),
                                              xycoords='data',
                                              boxcoords="offset points")
        if self.axes is not None:
            self.axes.add_artist(self.annotation_bbox)

    def on_mouse_wheel(self, event):
        if self.axes is not None:
            x_min, x_max = self.axes.get_xlim()
            x_delta = (x_max - x_min) / 10
            y_min, y_max = self.axes.get_ylim()
            y_delta = (y_max - y_min) / 10
            if event.button == "up":
                self.axes.set(xlim=(x_min + x_delta, x_max - x_delta))
                self.axes.set(ylim=(y_min + y_delta, y_max - y_delta))
            elif event.button == "down":
                self.axes.set(xlim=(x_min - x_delta, x_max + x_delta))
                self.axes.set(ylim=(y_min - y_delta, y_max + y_delta))

            self.draw_idle()

    def on_button_press(self, event):
        if event.inaxes is not None:  # 判断是否在坐标轴内
            if event.button == 1:
                self.lef_mouse_pressed = True
                self.pre_x = event.xdata
                self.pre_y = event.ydata

    def on_button_release(self, event):
        self.lef_mouse_pressed = False

    def on_mouse_move(self, event):
        if event.inaxes is not None and event.button == 1:
            if self.lef_mouse_pressed:
                x_delta = event.xdata - self.pre_x
                y_delta = event.ydata - self.pre_y
                # 获取当前原点和最大点的4个位置
                x_min, x_max = self.axes.get_xlim()
                y_min, y_max = self.axes.get_ylim()

                x_min = x_min - x_delta
                x_max = x_max - x_delta
                y_min = y_min - y_delta
                y_max = y_max - y_delta

                self.axes.set_xlim(x_min, x_max)
                self.axes.set_ylim(y_min, y_max)
                self.draw_idle()

    def hover(self, event):
        if event.inaxes == self.axes:
            x = event.xdata
            if x is not None:
                text = f"x: {x}" #显示横坐标值
                hPacker_list = self.text_box.get_children()
                time_hPacker = hPacker_list[0]
                time_text_area: TextArea = time_hPacker.get_children()[0]
                time_text_area.set_text(text)   # 更新横坐标值
                for index,line in enumerate(self.axes.get_lines()):
                    if line == self.vertline:  # 跳过光标线
                        continue
                    x_data = line.get_xdata()
                    y_data = line.get_ydata()
                    y = np.interp(x, x_data, y_data)
                    # 更新光标线的位置
                    self.vertline.set_xdata([x, x])
                    self.vertline.set_ydata([self.axes.get_ylim()[0], self.axes.get_ylim()[1]])
                    # 显示每条曲线的详细信息
                    line_text = f"{line.get_label()}: {y:.3f}"
                    hPacker = hPacker_list[index+1] # 因为横坐标值放在了第一个hPacker中,所以从第二个开始
                    text_area: TextArea = hPacker.get_children()[0]
                    text_area.set_text(line_text)

                # 更新AnnotationBbox的位置
                self.annotation_bbox.xy = (x, event.ydata)
                self.annotation_bbox.set_visible(True)
                self.draw_idle()
            else:
                # 隐藏AnnotationBbox和光标线
                self.annotation_bbox.set_visible(False)
                self.vertline.set_xdata([])
                self.vertline.set_ydata([])
                self.draw_idle()

class MainWindow(QMainWindow):
    def __init__(self):
        super().__init__()

        self.widget = QWidget()
        self.setMinimumHeight(600)
        self.setMinimumWidth(800)
        self.showMaximized() # 设置全屏
        self.setCentralWidget(self.widget)

        layout = QVBoxLayout(self.widget)

        self.mpl_widget = MatplotlibWidget(self.widget, width=5, height=4, dpi=100)
        layout.addWidget(self.mpl_widget)

        self.show()


if __name__ == "__main__":
    app = QApplication(sys.argv)
    mainWin = MainWindow()
    sys.exit(app.exec_())
感觉matplotlib库更适用于静态图表的分析,即使自己造了这些轮子,但总感觉还是不如echats好用,不过echarts性能方面还是不如matplotlib的,毕竟两者的应用场景确实不一样。
到此这篇关于Python结合matplotlib实现图表的基本交互的文章就介绍到这了,更多相关Python matplotlib图表交互内容请搜索风君子博客以前的文章或继续浏览下面的相关文章希望大家以后多多支持风君子博客!
您可能感兴趣的文章:
- Python+mpld3实现交互式Matplotlib图表
- Python中利用mpld3创建交互式Matplotlib图表的代码示例
- 使用Python的Matplotlib库创建动态图表的技巧与实践分享
- 在Python中使用Matplotlib绘制常见图表方式
- Python中使用matplotlib绘制各类图表示例详解
- Python利用matplotlib画出漂亮的分析图表