文章目录
目录
- 一、静态图
- 二、动态图
- 总结
【代码】Python绘制TSP、VRP问题求解结果图(包含静态图与动态图)。
import matplotlib.pyplot as plt


def plot_tour(data, best_path, is_save):
    """
    绘制旅行图
    :param data: 包含位置坐标的字典类型数据
    :param best_path: 最优旅行路径
    :param is_save: 是否保存绘图
    :return:
    """
    x = []
    y = []
    text_list = []
    for v in best_path:
        x.append(data[v][0])
        y.append(data[v][1])
        text_list.append(str(v))

    for i in range(len(text_list)):
        plt.text(x[i], y[i], text_list[i], ha='center', va='center_baseline')

    plt.plot(x, y, 'co--', linewidth=2, markersize=12)
    if is_save:
        plt.savefig("best_tour.png")
    plt.show()


def vrp():
    data = {
        1: (710.0, 1310.0),
        2: (630.0, 1660.0),
        3: (40.0, 2090.0),
        4: (750.0, 1100.0),
        5: (750.0, 2030.0),
        6: (1030.0, 2070.0),
        7: (1650.0, 650.0),
        8: (1490.0, 1630.0),
        9: (790.0, 2260.0),
        10: (1150.0, 1760.0),
        11: (840.0, 550.0),
        12: (1170.0, 2300.0),
        13: (970.0, 1340.0),
        14: (510.0, 700.0),
        15: (750.0, 900.0),
        16: (1280.0, 1200.0),
        17: (230.0, 590.0),
        18: (460.0, 860.0),
        19: (1040.0, 950.0),
        20: (590.0, 1390.0),
        21: (830.0, 1770.0),
        22: (490.0, 500.0),
        23: (1840.0, 1240.0),
        24: (1260.0, 1500.0),
        25: (1280.0, 790.0),
        26: (490.0, 2130.0),
        27: (1460.0, 1420.0),
        28: (1260.0, 1910.0),
        29: (360.0, 1980.0)
    }
    best_path = [1, 4, 15, 18, 17, 14, 22, 11, 19, 25, 7, 23, 27, 8, 24, 16, 13, 1,
                 1, 21, 10, 28, 6, 12, 9, 5, 26, 29, 3, 2, 20, 1]
    plot_tour(data, best_path, False)


def tsp():
    data = {
        1: (1150.0, 1760.0),
        2: (630.0, 1660.0),
        3: (40.0, 2090.0),
        4: (750.0, 1100.0),
        5: (750.0, 2030.0),
        6: (1030.0, 2070.0),
        7: (1650.0, 650.0),
        8: (1490.0, 1630.0),
        9: (790.0, 2260.0),
        10: (710.0, 1310.0),
        11: (840.0, 550.0),
        12: (1170.0, 2300.0),
        13: (970.0, 1340.0),
        14: (510.0, 700.0),
        15: (750.0, 900.0),
        16: (1280.0, 1200.0),
        17: (230.0, 590.0),
        18: (460.0, 860.0),
        19: (1040.0, 950.0),
        20: (590.0, 1390.0),
        21: (830.0, 1770.0),
        22: (490.0, 500.0),
        23: (1840.0, 1240.0),
        24: (1260.0, 1500.0),
        25: (1280.0, 790.0),
        26: (490.0, 2130.0),
        27: (1460.0, 1420.0),
        28: (1260.0, 1910.0),
        29: (360.0, 1980.0)
    }
    best_path = [1, 28, 6, 12, 9, 5, 26, 29, 3, 2, 20, 10, 4, 15, 18, 17,
                 14, 22, 11, 19, 25, 7, 23, 27, 8, 24, 16, 13, 21, 1]
    plot_tour(data, best_path, False)


vrp()
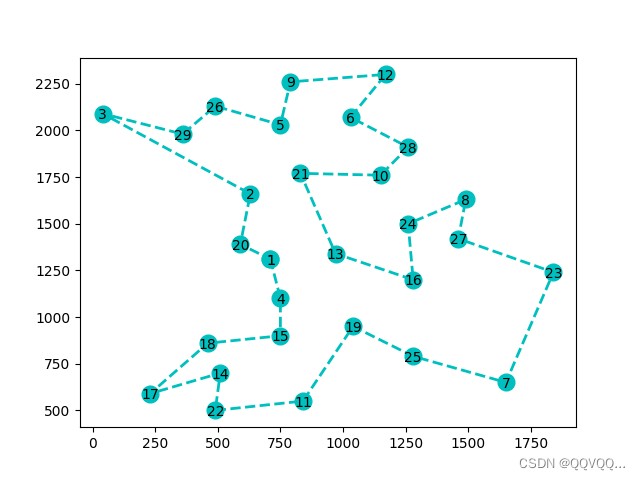
TSP结果图
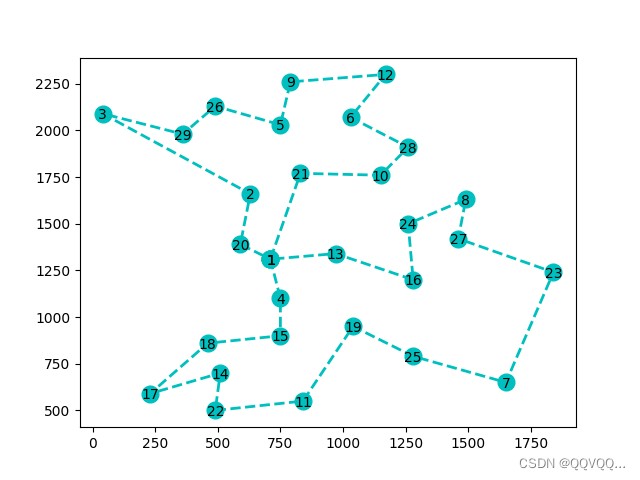
VRP结果图
原理:
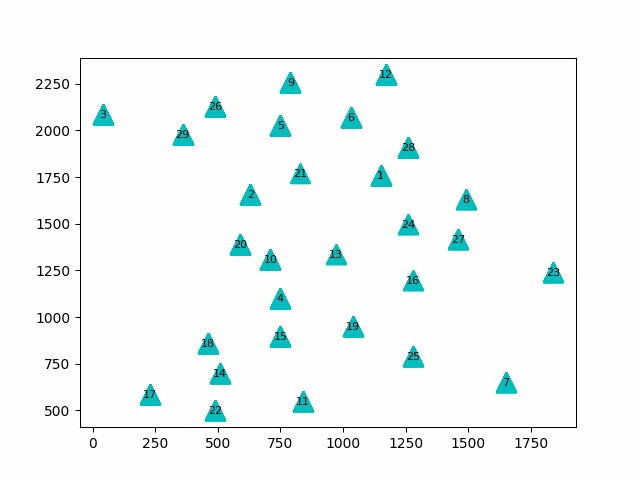
利用matplotlib的animation模块进行动态图的制作,其中保存为gif图片时需要使用PIL包,否则无法保存。
import matplotlib.pyplot as plt
import matplotlib.animation as animation
import PIL


def plot_tour(data, best_path, is_save):
    """
    绘制旅行图
    :param data: 包含位置坐标的字典类型数据
    :param best_path: 最优旅行路径
    :param is_save: 是否保存绘图
    :return:
    """
    fig, ax = plt.subplots()
    x = []
    y = []
    figure_list = []
    text_list = []
    for v in best_path:
        x.append(data[v][0])
        y.append(data[v][1])
        text_list.append(str(v))

        ax.plot(x, y, 'c^', linewidth=2, markersize=15)
        ax.text(data[v][0], data[v][1], str(v), ha='center', va='center_baseline', size=8)

        figure = ax.plot(x, y, '--', linewidth=2, markersize=20)

        figure_list.append(figure)
    ani = animation.ArtistAnimation(fig, figure_list, interval=200, repeat_delay=0)

    # 保存图片
    ani.save("test.gif")

    plt.show()


def vrp():
    data = {
        1: (1150.0, 1760.0),
        2: (630.0, 1660.0),
        3: (40.0, 2090.0),
        4: (750.0, 1100.0),
        5: (750.0, 2030.0),
        6: (1030.0, 2070.0),
        7: (1650.0, 650.0),
        8: (1490.0, 1630.0),
        9: (790.0, 2260.0),
        10: (710.0, 1310.0),
        11: (840.0, 550.0),
        12: (1170.0, 2300.0),
        13: (970.0, 1340.0),
        14: (510.0, 700.0),
        15: (750.0, 900.0),
        16: (1280.0, 1200.0),
        17: (230.0, 590.0),
        18: (460.0, 860.0),
        19: (1040.0, 950.0),
        20: (590.0, 1390.0),
        21: (830.0, 1770.0),
        22: (490.0, 500.0),
        23: (1840.0, 1240.0),
        24: (1260.0, 1500.0),
        25: (1280.0, 790.0),
        26: (490.0, 2130.0),
        27: (1460.0, 1420.0),
        28: (1260.0, 1910.0),
        29: (360.0, 1980.0)
    }
    best_path = [10, 4, 15, 18, 17, 14, 22, 11, 19, 25, 7, 23, 27, 8, 24, 16, 13, 10,
                 10, 21, 1, 28, 6, 12, 9, 5, 26, 29, 3, 2, 20, 10]
    plot_tour(data, best_path, False)


def tsp():
    data = {
        1: (1150.0, 1760.0),
        2: (630.0, 1660.0),
        3: (40.0, 2090.0),
        4: (750.0, 1100.0),
        5: (750.0, 2030.0),
        6: (1030.0, 2070.0),
        7: (1650.0, 650.0),
        8: (1490.0, 1630.0),
        9: (790.0, 2260.0),
        10: (710.0, 1310.0),
        11: (840.0, 550.0),
        12: (1170.0, 2300.0),
        13: (970.0, 1340.0),
        14: (510.0, 700.0),
        15: (750.0, 900.0),
        16: (1280.0, 1200.0),
        17: (230.0, 590.0),
        18: (460.0, 860.0),
        19: (1040.0, 950.0),
        20: (590.0, 1390.0),
        21: (830.0, 1770.0),
        22: (490.0, 500.0),
        23: (1840.0, 1240.0),
        24: (1260.0, 1500.0),
        25: (1280.0, 790.0),
        26: (490.0, 2130.0),
        27: (1460.0, 1420.0),
        28: (1260.0, 1910.0),
        29: (360.0, 1980.0)
    }
    best_path = [1, 28, 6, 12, 9, 5, 26, 29, 3, 2, 20, 10, 4, 15, 18, 17,
                 14, 22, 11, 19, 25, 7, 23, 27, 8, 24, 16, 13, 21, 1]
    plot_tour(data, best_path, False)


tsp()
以上为个人经验,希望能给大家一个参考,也希望大家多多支持风君子博客。
您可能感兴趣的文章:
- windows下python使用ffmpeg实现rtsp推流
- Python进行ffmpeg推流和拉流rtsp、rtmp实例详解
- Python 遗传算法处理TSP问题详解
- Python PSO算法处理TSP问题详解